IC Markets Home Sign in Web Trader Contáctanos
IC Markets Social IC Markets Social

Información para
Operadores Serios

  • Acerca de IC Markets
  • ABRA UNA CUENTA BURSÁTIL
  • PRUEBE UNA DEMO GRATIS
  • Comienza a Operar
  • VISIT OUR BLOG
IC Markets Social
  • Acerca de IC Markets
  • ABRA UNA CUENTA BURSÁTIL
  • PRUEBE UNA DEMO GRATIS
  • Comienza a Operar
  • VISIT OUR BLOG
April 29, 2024Australian_Stocks_enIC Markets

Huge movement on Australia 200 Index, did you miss it?

Australia 200 Index has moved higher by 0.84% from 7561.2 to 7624.56 in the last 3 days.

Read more
April 26, 2024Australian_Stocks_enIC Markets

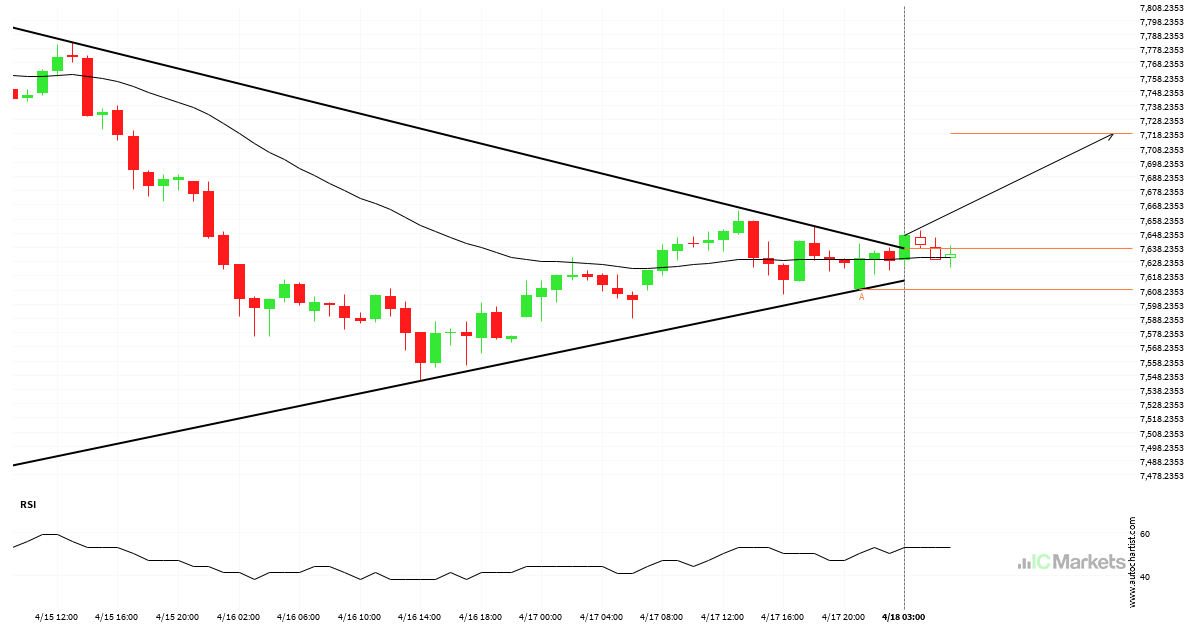
Australia 200 Index – Continuation Chart Pattern – Channel Up

Australia 200 Index was identified at around 7590.09 having recently rebounded of the support on the 4 hour data interval. Ultimately, the price action of the stock has formed a Channel Up pattern. This squeeze may increases the chances of a strong breakout. The projected movement will potentially take the price to around the 7756.3847 […]

Read more
April 25, 2024Australian_Stocks_enIC Markets

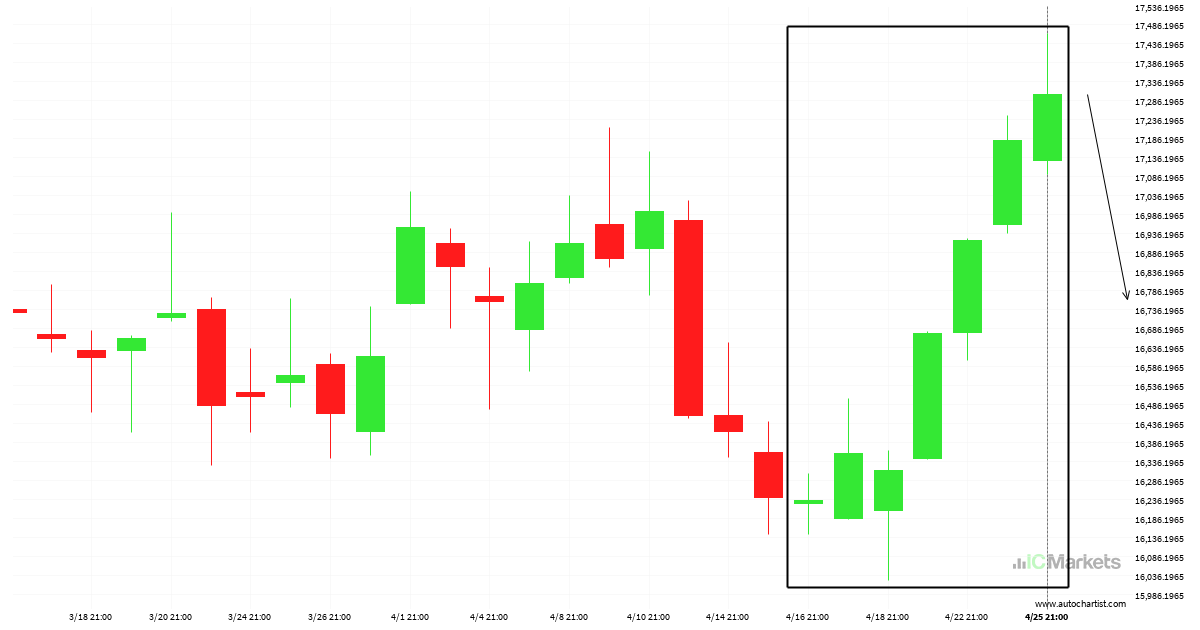
Hong Kong 50 Index – Large movement, a rare opportunity

Due to the rate of consecutive bullish candles on Hong Kong 50 Index Daily chart we could be in for a price correction. If not, this trend could be a sign of things to come

Read more
April 24, 2024Australian_Stocks_enIC Markets

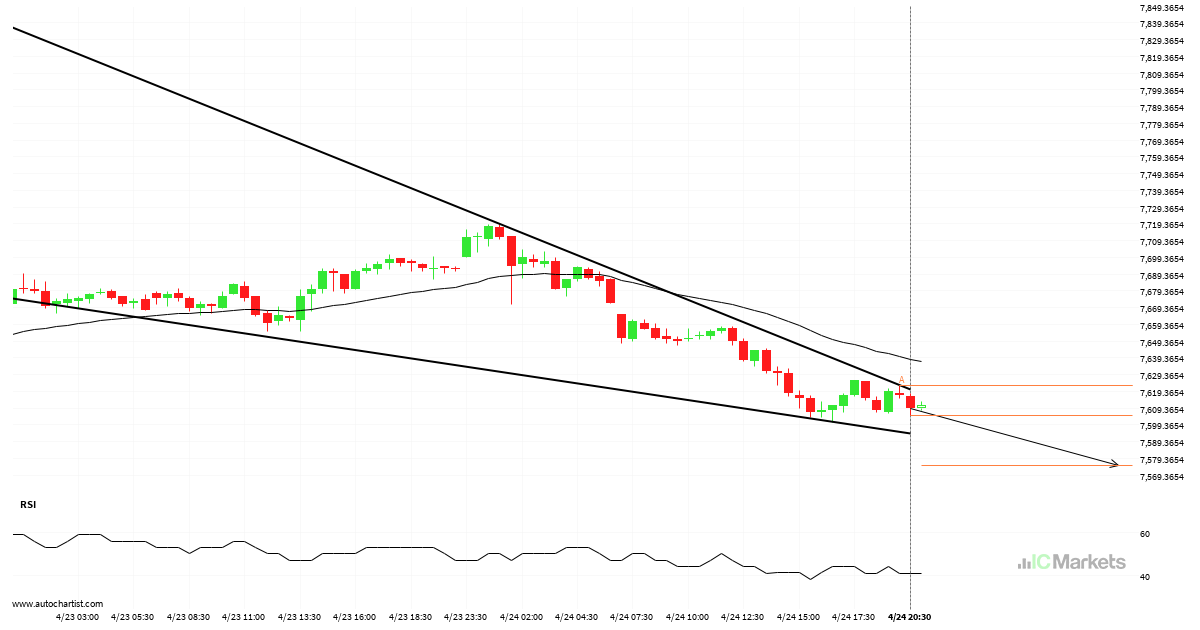
Australia 200 Index approaching support of a Falling Wedge

Australia 200 Index is approaching the support line of a Falling Wedge. It has touched this line numerous times in the last 3 days. If it tests this line again, it should do so in the next 11 hours.

Read more
April 22, 2024Australian_Stocks_enIC Markets

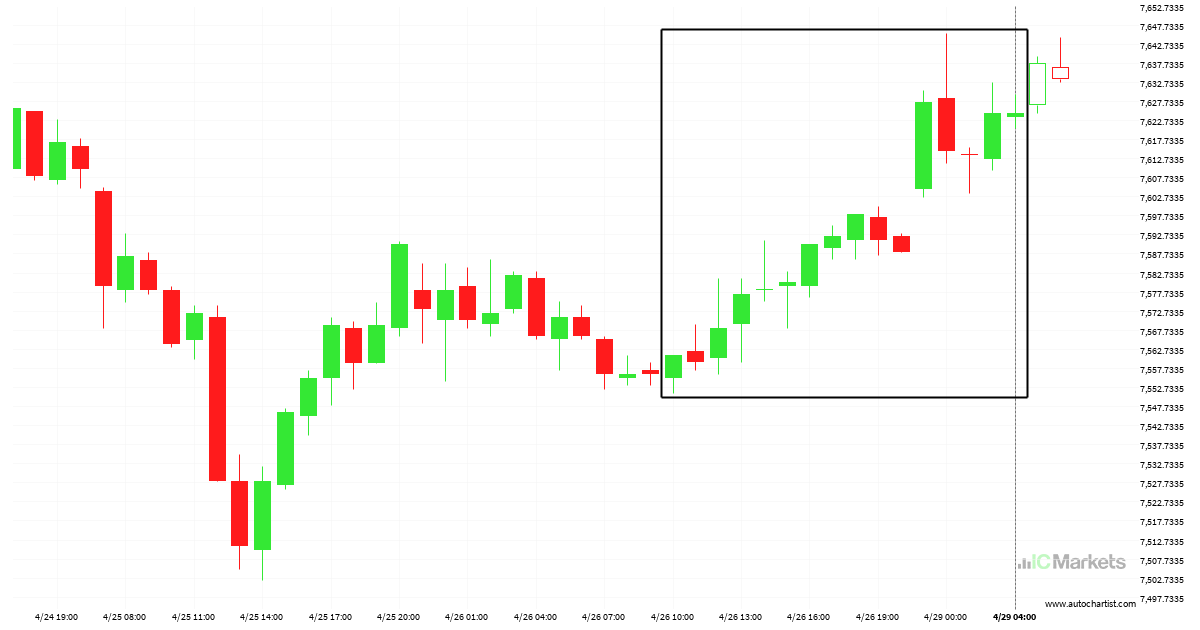
Australia 200 Index breakout through resistance

Australia 200 Index has breached the resistance line at 7634.2998. It may continue the bullish trend towards 7698.5942, or, it may prove to be yet another test of this level.

Read more
April 19, 2024Australian_Stocks_enIC Markets

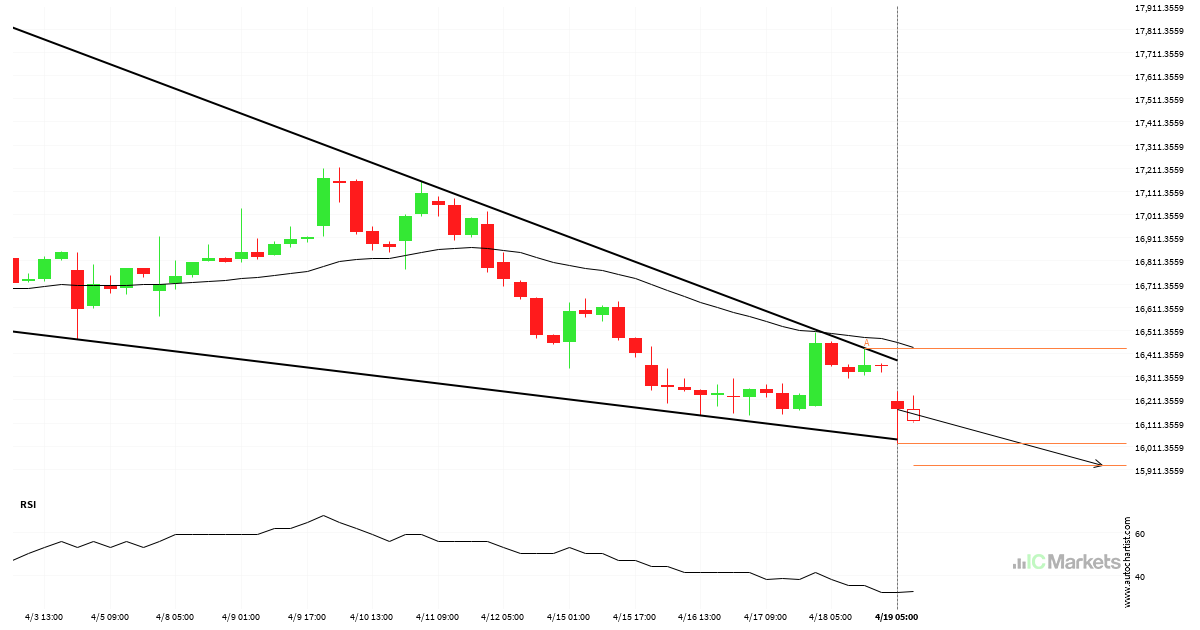
Hong Kong 50 Index – Continuation Chart Pattern – Falling Wedge

Emerging Falling Wedge pattern in its final wave was identified on the Hong Kong 50 Index 4 hour chart. After a strong bearish run, we find Hong Kong 50 Index heading towards the upper triangle line with a possible resistance at 15930.0225. If the support shows to hold, the Falling Wedge pattern suggests a rebound […]

Read more
April 18, 2024Australian_Stocks_enIC Markets

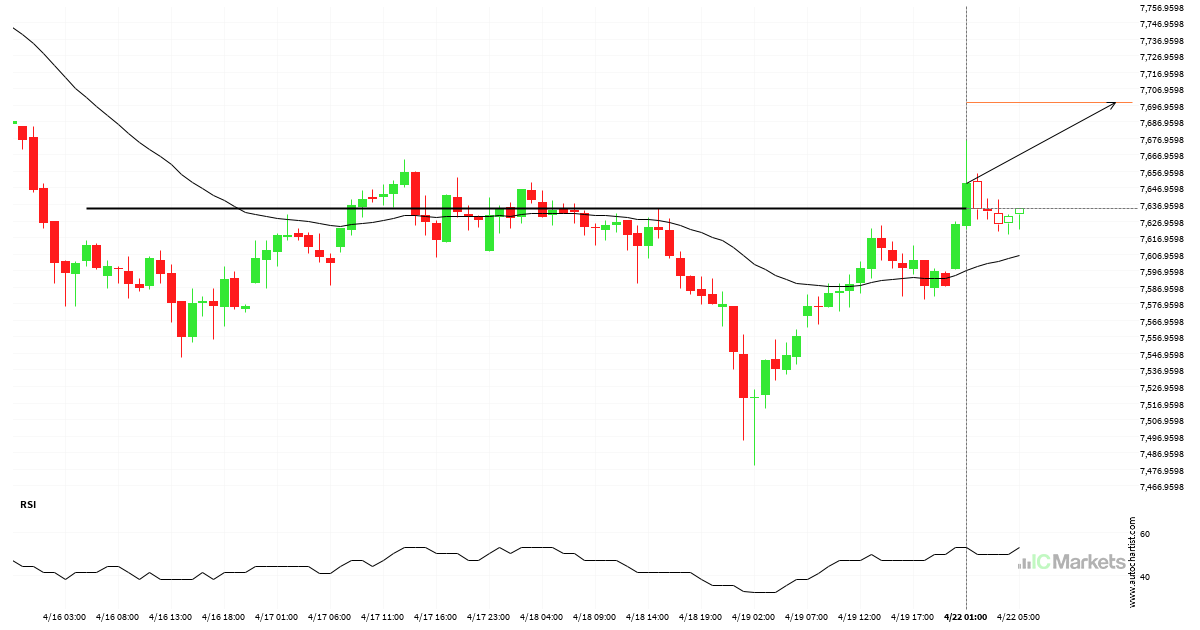
Resistance line breached by Australia 200 Index

Australia 200 Index has broken through the resistance line which it has tested twice in the past. We have seen it retrace from this line before, so one should wait for confirmation of the breakout before trading. If this new trend persists, a target level of around 7718.5875 may materialize within the next 14 hours.

Read more
April 16, 2024Australian_Stocks_enIC Markets

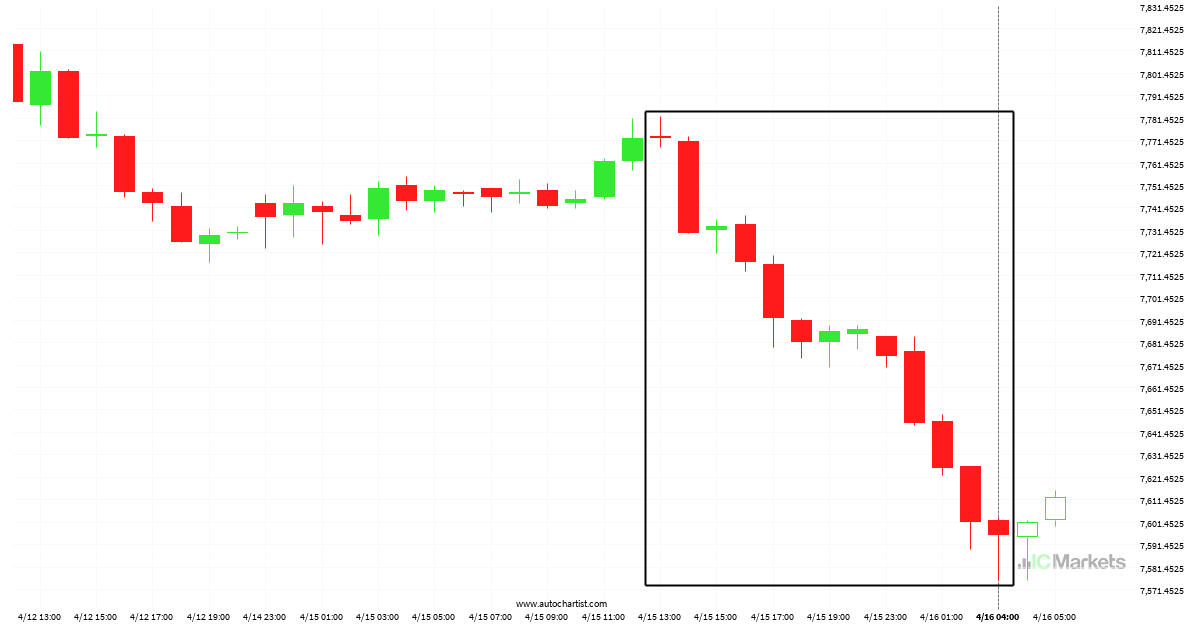
Australia 200 Index was on its way down

Australia 200 Index hits 7595.41 after a 2.28% move spanning 15 hours.

Read more
April 15, 2024Australian_Stocks_enIC Markets

Possible breach of support level by Australia 200 Index

Emerging Falling Wedge detected on Australia 200 Index – the pattern is an emerging one and has not yet broken through resistance, but the price is expected to move up over the next few hours. The price at the time the pattern was found was 7725.3 and it is expected to move to 7698.6472.

Read more
April 14, 2024Australian_Stocks_enIC Markets

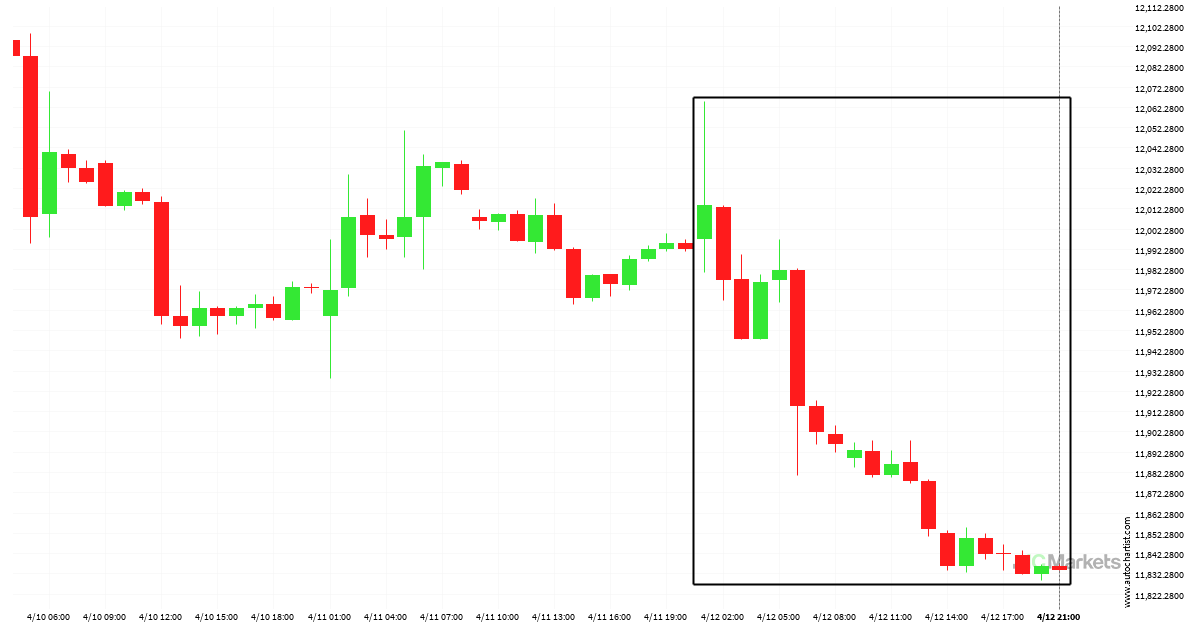
Huge movement on FTSE China A50 Index, did you miss it?

FTSE China A50 Index has experienced an exceptionally large movement lower by 1.5% from 12013.99 to 11833.99 in the last 20 hours.

Read more
  • 1
  • 2
  • 3
  • …
  • 12
  • 13
  • 14
  • 15
  • 16
  • 17
  • 18
  • …
  • 153
  • 154
  • 155

Recent Posts

  • Hong Kong 50 Index – المستوى الرئيسي – مقاومة
  • Hong Kong 50 Index – ระดับสำคัญ – แนวต้าน
  • Hong Kong 50 Index – ระดับสำคัญ – แนวต้าน
  • Australia 200 Index – ระดับสำคัญ – แนวรับ
  • Australia 200 Index – المستوى الرئيسي – سند

Recent Comments

    Traducción


     Edit Translation

    Opere con un

    líder del mercado en el que puede confiar

    ABRA UNA CUENTA BURSÁTIL PRUEBE UNA DEMO GRATIS

    Trading en Forex

    • Qué es Raw Spread
    • Resumen de cuentas
    • Abre una Cuenta
    • Trader Launch en Web

    Especificaciones de Trading

    • Spreads y Comisiones
    • Rango de Mercados
    • Horas de Trading
    • Depósitos
    • Retiros

    Acerca de IC Markets

    • Help Center
    • Por qué con IC Markets
    • Regulación
    • Documentos Legales
    • Contáctanos


    Forex Trading

    • Accounts Overview
    • Open an Account
    • Launch Web Trader

    Trading Specifications

    • Spreads and Commissions
    • Range of Market
    • Trading Hours
    • Funding
    • Withdrawal

    About IC Markets

    • Chat with a Specialist 24/7
    • Why IC Markets
    • Regulation
    • Legal Documents
    • Contáctanos

    Descargo de responsabilidad: Estos documentos son material de marketing cuyo contenido es publicado solo con propósitos informativos. Este material no contiene y no debe ser considerado un consejo de inversión y recomendaciones, o sugerencias para llevar a cabo otras acciones con los instrumentos financieros. Los widgets integrados pertenecen a sus autores independientes externo, y IC Markets no es responsable de su contenido o cómo afectan en las operaciones.

    Derechos reservados de todo el contenido. Las opiniones de los autores tal vez no coincidan con la opinión de los editores del blog. Cuando copie material de este sitio o conecte RSS para volver a publicar nuestros artículos, es obligatorio el enlace a IC Markets o la atribución en el formato “Blog de IC Market”. Para dudas generales, por favor, póngase en contacto con la oficina editorial a través de la página “Contacto”.

    Advertencia de riesgo: Operar derivados conlleva un altor riesgo en su capital y solo debería operar con capital que puede permitirse perder. Las operaciones con derivados podrían no ser adecuadas para todos los inversores, por lo tanto, asegúrese de entender por completo los riesgos que conlleva y buscar asesoramiento independiente si fuera necesario. Una Declaración de Divulgación del Producto (PDS, por sus siglas en inglés) se tendrá en cuenta antes de participar en una transacción con nosotros.

    Los contenidos de esta página son solo información general y no tienen en cuenta su situación personal, objetivos financieros o necesidades. Depende de usted garantizar que los productos que ofrecemos se ajustas a sus necesidades específicas. No debería operar con nosotros a menos que entienda las características y riesgos de los productos que ofrecemos. Esto significa que tal vez necesite buscar asesoramiento independiente antes de empezar a operar con nosotros.

    © 2022 Raw Trading Ltd | All rights reserved.
    • Sample Page